
Welcome to thatlinuxbox.com Thursday, July 16 2026 @ 06:56 AM UTC
Items in Grafana Panel Library are Greyed Out
- Wednesday, October 19 2022 @ 11:06 PM UTC
- Contributed by: Dan Stoner
- Views: 3,532


I ran into a problem the other day that items in a Grafana Panel Library were greyed out and I couldn't add them to a dashboard.
tldr; The underlying cause is that panels of visualization type “Graph (old)” are not able to be added to a dashboard from the Panel Library.
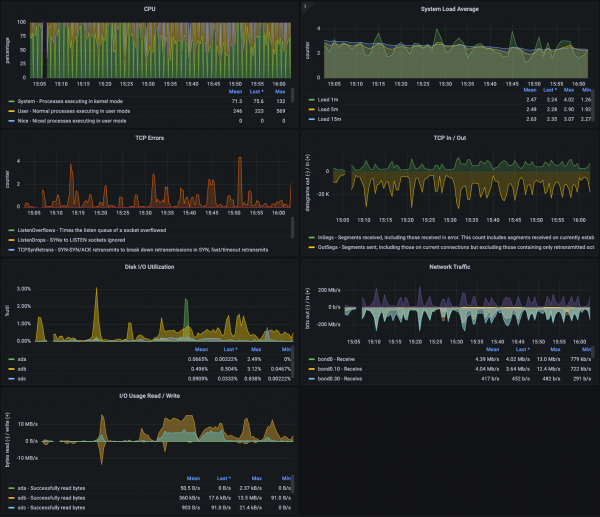
I have done a bit of work getting my company's PostgreSQL database servers monitored with prometheus and grafana. I put together a combined DBA dashboard that has my most-used metrics gathered all together... this includes metrics from postgres, pgbouncer, and the host systems.
I have had this little open space in my DBA Dashboard for a few months and had not yet decided what graph I wanted to put there. I finally decided I wanted to include another graph from Node Exporter.
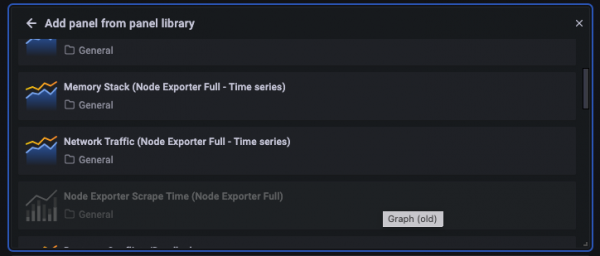
The first step is to add an existing panel of interest to the Panel Library. From there, it is straightforward to Add panel from library.
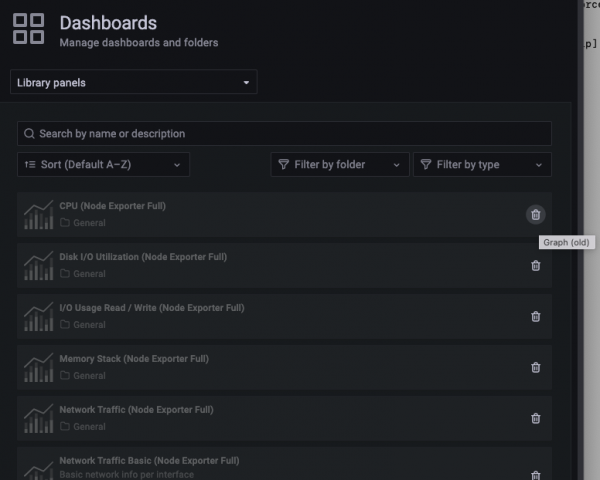
However, when I tried to add the panel from the Panel Library, most of the available panels were greyed out.
I tried various google searches like Items in Grafana Panel Library are Greyed Out or Cannot Add Panel from Library and didn't find a solution, hence the reason I am writing this blog post.
I tried Importing the latest version of the Node Exporter Dashboard from grafana.com but that did not fix the issue either.
The underlying cause is that panels containing deprecated visualization types such as “Graph (old)” are not able to be added to a dashboard from the Panel Library. It looks like Grafana is trying to kill off the deprecations and after some minor version upgrade (I could not track down the specifics) appears to be preventing that capability.
Hovering over a panel in the Panel Library will show the visualization type.
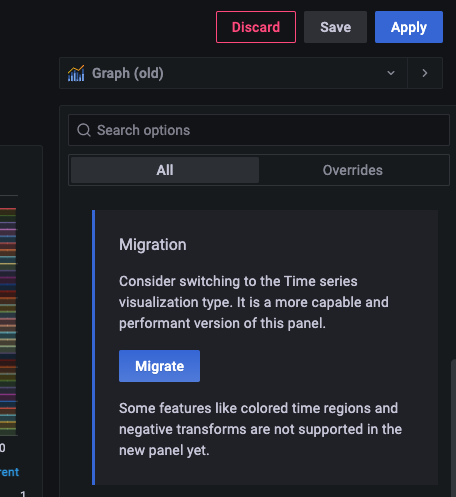
To resolve, edit the source panel and click the Migrate button. Then save the panel. At that point the panel will be of "Time series" visualization type and can be added to a dashboard from the Panel Library.
I didn't find a description of this exact behavior in the release notes.
Upgrade to at least Grafana 9.2 in order to gain the ability to Delete deprecated panels.
tldr; The underlying cause is that panels of visualization type “Graph (old)” are not able to be added to a dashboard from the Panel Library.
I have done a bit of work getting my company's PostgreSQL database servers monitored with prometheus and grafana. I put together a combined DBA dashboard that has my most-used metrics gathered all together... this includes metrics from postgres, pgbouncer, and the host systems.
I have had this little open space in my DBA Dashboard for a few months and had not yet decided what graph I wanted to put there. I finally decided I wanted to include another graph from Node Exporter.
The first step is to add an existing panel of interest to the Panel Library. From there, it is straightforward to Add panel from library.
However, when I tried to add the panel from the Panel Library, most of the available panels were greyed out.
I tried various google searches like Items in Grafana Panel Library are Greyed Out or Cannot Add Panel from Library and didn't find a solution, hence the reason I am writing this blog post.
I tried Importing the latest version of the Node Exporter Dashboard from grafana.com but that did not fix the issue either.
The underlying cause is that panels containing deprecated visualization types such as “Graph (old)” are not able to be added to a dashboard from the Panel Library. It looks like Grafana is trying to kill off the deprecations and after some minor version upgrade (I could not track down the specifics) appears to be preventing that capability.
Hovering over a panel in the Panel Library will show the visualization type.
To resolve, edit the source panel and click the Migrate button. Then save the panel. At that point the panel will be of "Time series" visualization type and can be added to a dashboard from the Panel Library.
I didn't find a description of this exact behavior in the release notes.
Upgrade to at least Grafana 9.2 in order to gain the ability to Delete deprecated panels.
 GitHub


The following comments are owned by whomever posted them. This site is not responsible for what they say.